


Reading the NYC Mayoral Race: How Maximum Difference Reveals the True Shape of a Crowded Ranked-Choice Election
Why traditional polls fall short—and how MaxDiff modeling captures the real momentum in ranked-choice elections.

How can a pollster take a snapshot of a crowded ranked-choice voting (RCV) primary three months before election day?
It’s not as simple as asking respondents who they plan to vote for and who their second choice would be. That’s because once the vote counting begins, some candidates may be eliminated, dramatically reshaping the field.
Ranked-choice voting is an electoral system in which voters rank candidates by preference. If a candidate receives a majority of first-choice votes, they win outright. If no candidate reaches that threshold, the one with the fewest first-choice votes is eliminated. Votes for the eliminated candidate are then redistributed to the next-ranked choice on each affected ballot. This process continues until a candidate achieves a majority.
This article introduces a highly effective method for rank-ordering candidates at any point in the race. It goes beyond measuring first-choice preferences and incorporates second and third choices—even for lesser-known candidates. This approach not only gives a clearer picture of the current standings but can also be tracked over time to guide communication and electoral strategy as the race tightens.
Maximum Difference Scaling
Maximum Difference Analysis (or MaxDiff) is another powerful method of choice modeling. In this approach, respondents are shown sets of three or more candidates and asked to select the one they like the most and the one they like the least.
MaxDiff enables pollsters and political strategists to test a wide field of candidates without requiring respondents to rank them all manually—a task that can be cognitively demanding and unreliable. It offers a more nuanced alternative to the simple “Who would you vote for?” question by capturing relative preferences across a range of potential matchups, including those that might not be directly compared in traditional polls.
This methodology provides insights into positive sentiment, negative sentiment, and—perhaps most critically—name recognition. Above all, MaxDiff gives campaign teams a clear, data-driven sense of “what’s really going on” well before the race intensifies.
Our Large Primary
For the purposes of this article, let’s consider a fictional race with the top eight candidates running for mayor in an unnamed city. Under the city’s previous election rules, a runoff would be triggered if no candidate received at least 40% of the vote.
Under the new ranked-choice voting rules, however, if no candidate wins a majority of first-choice votes, the process moves to second-choice preferences, and so on, until one candidate surpasses the 50% threshold. This guarantees that a winner will be declared on primary day—no runoff required.
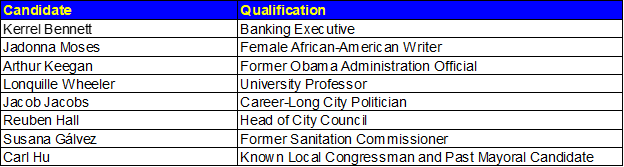
There are eight candidates in the race. With the election still three months away, most voters are not yet fully engaged. A well-known congressman and a former mayoral candidate are dominating media coverage, while several long-time and locally popular figures have also entered the race.
Here’s a fictional snapshot of the field: at this early stage, the leading response in a traditional poll is “Undecided” at 26%. The next highest is a celebrity candidate with 16%, making them the nominal front-runner for now. But with a fluid field and low voter attention, much can still change.
After collecting demographic information at the beginning (or end) of the survey, respondents are asked:
“Thinking about the candidates running in this year’s Democratic primary election for mayor, if the election were held today, who would be your first-choice candidate?”
They are then asked:
“If the Democratic mayoral primary were held today, who would be your second-choice candidate?”
These responses typically yield results similar to those of a traditional horse-race poll. Below are the results from this initial round of questions.

At this stage, the race remains fluid, with no candidate commanding a clear majority. Without explicitly capturing second-choice preferences, it's impossible to accurately model how ranked-choice redistribution will unfold.
What we’re proposing is a complementary “snapshot” of the race—one that offers early signals of where voter support may shift as engagement increases. This approach incorporates not just top-line preferences but also relative favorability and unfavorability between candidates. By doing so, it provides a forward-looking metric of how second-choice votes may be allocated, functioning as an early indicator of candidate viability under ranked-choice dynamics.
Maximum Difference Scaling in Use
Maximum Difference (MaxDiff) analysis can be a powerful tool for ranking candidates in a political race. In this example, we’ll apply the method to our fictional city mayoral race.
Rather than directly asking respondents whom they intend to vote for, MaxDiff captures in-the-moment preferences by presenting respondents with subsets of candidates and asking them to identify the one they are most likely—and least likely—to support. This approach is particularly useful for evaluating lesser-known candidates and capturing relative sentiment across the field.
Each respondent will complete a series of choice tasks. In each one, they’ll be shown a small group of candidates and asked to select the candidate they are most likely to vote for and the one they are least likely to vote for. A sample prompt might look like the following:
You will now evaluate candidates in a series of six MaxDiff tasks, each consisting of four candidates. In each task, select the candidate you are most likely to vote for and the one you are least likely to vote for based on your current impressions.
Of the four candidates below, at the moment who are MOST likely to vote for and the LEAST likely to vote for?
1) Lonquille Wheeler
2) Reuben Hall
3) Luciana Mireles
4) Jacob Jacobs
Of the four candidates below, at the moment who are MOST likely to vote for and the LEAST likely to vote for?
1) Reuben Hall
2) Luciana Mireles
3) Kerrel Bennett
4) Arthur Keegan
Each respondent completes five additional MaxDiff tasks, with candidates rotating in both position and order across the sets. Each candidate appears in exactly three tasks per respondent. To minimize order effects and enhance robustness, the design varies across respondents. For example, in a sample of 300 likely voters, we might generate 100 unique candidate sets—ensuring randomized exposure and reducing bias from presentation effects.
The output includes two key metrics:
Raw scores, reflecting the frequency with which each candidate was selected as “most likely” or “least likely.”
Choice coefficients, derived via logistic regression, representing the probability of a candidate being chosen when presented. These coefficients are also known as Bayesian utility scores and are standard in most choice modeling applications.
We use these Bayesian coefficients to construct an initial “horse race” snapshot of the field. Each respondent receives a utility score for every candidate, which can then be ranked from 1 to 8. This transformation enables us to simulate a ranked-choice voting process:
First round: Candidates are ranked by their top-choice scores.
Second round: The lowest-ranked candidate is eliminated. First and second choices are combined, and the tally is updated.
Third round: The next-lowest candidate is removed. First, second, and third preferences are combined, and the vote is retallied.
This process continues until one candidate surpasses the 50% threshold.
Because the survey instrument remains consistent, this approach can be deployed at regular intervals—weekly, biweekly, or monthly—without requiring redesign. This allows for the creation of a time series to monitor voter sentiment, candidate momentum, and shifts in consolidation across the race.
The table below presents modeled results from a survey conducted three months prior to the primary.
From these results, we see that Reuben Hall would likely win if the election were held today under a simple plurality system. However, Susana Galvez remains a close second. Notably, neither of the two front-runners receives significant support in second, third, or fourth-choice rankings. This suggests a polarized electorate, with distinct voter blocs forming around each leading candidate.
Meanwhile, other competitive candidates—such as Jadonna Moses and Carl Hu—perform well in the initial rounds but fail to expand their appeal as lower-ranked candidates are eliminated. This lack of upward movement highlights the challenge of gaining second-choice support, a critical factor in ranked-choice scenarios.
City Primary Ranked Choice Primary Results

Below is the table showing the final results from the 2021 New York City mayoral primary. As you'll notice, the output structure closely resembles our simulation. However, there are important differences. The New York City race featured a larger candidate field, and its ranked-choice voting system allowed for the elimination of multiple candidates in a single round. These nuances can be incorporated into any polling simulation to more accurately reflect specific election rules and dynamics.

MaxDiff ranking is a sophisticated tool for capturing a dynamic "snapshot" of a political race at a given moment. Unlike traditional polling, which often focuses narrowly on head-to-head matchups among top-tier candidates, MaxDiff provides a richer understanding of voter sentiment across the entire field. It is especially valuable in crowded primaries, fragmented parliamentary elections, or open contests with multiple candidates across parties.
Traditional polls may detect early front-runners but often miss key dynamics—such as candidates who perform well in the first round but lose support as the field narrows, or under-the-radar contenders who build momentum and surge in later rounds. MaxDiff excels at revealing these patterns.
While choice modeling is not new, MaxDiff is emerging as one of the most accessible and effective tools for political strategy. It allows campaigns to assess the depth and extendibility of a candidate’s support, fine-tune messaging, and track shifts in the competitive landscape. Whether used for strategic planning, communications refinement, or competitive monitoring, MaxDiff offers data-driven insights that help campaigns stay one step ahead in fluid electoral environments..